Community Collaborative Charter
32248 Crown Valley Road
Acton, CA 93510
| CSR Rank: |
8 |
out of 102 |
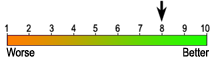 |
Percentile:
(2016) | 71.261-d |
|
Compare to 2013 - Rank: None, API Score: |
|
|---|
2016 CAASPP Test Score Details:
| Grade | Test Type | Mean Score | Exceeded
Standard | Met
Standard | Nearly Met
Standard |
Standard
Not Met |
|---|
| 3 | English | 2412.1 |
23% | 21% | 20% |
36% |
| 3 | Math | 2413.9 |
16% | 25% | 26% |
33% |
| 4 | English | 2447.2 |
20% | 19% | 23% |
38% |
| 4 | Math | 2448.6 |
13% | 23% | 34% |
31% |
| 5 | English | 2494.1 |
20% | 29% | 20% |
31% |
| 5 | Math | 2477.7 |
13% | 13% | 38% |
36% |
| 6 | English | 2516.7 |
13% | 27% | 40% |
21% |
| 6 | Math | 2505.1 |
15% | 15% | 31% |
39% |
| 7 | English | 2554.6 |
16% | 35% | 28% |
21% |
| 7 | Math | 2532.4 |
15% | 24% | 34% |
27% |
| 8 | English | 2576.9 |
13% | 47% | 24% |
16% |
| 8 | Math | 2522.6 |
10% | 13% | 34% |
44% |
| 11 | English | 2592.0 |
18% | 42% | 22% |
18% |
| 11 | Math | 2532.4 |
6% | 9% | 25% |
60% |
- Asterisk "*", if present, indicates scores are not available (too few)
Calculated Percentiles from California School Ratings:
| English Language Arts/Literacy |
Mathematics |
| Grade | Percentile | Students Tested | Percentile | Students Tested |
| 3 | 53.18% | 136 |
44.81% | 136 |
| 4 | 49.02% | 121 |
44.76% | 120 |
| 5 | 54.79% | 112 |
51.08% | 113 |
| 6 | 53.35% | 111 |
53.94% | 112 |
| 7 | 65.32% | 98 |
60.76% | 98 |
| 8 | 68.23% | 70 |
44.37% | 71 |
| 11 | 55.11% | 66 |
44.65% | 66 |
Weighted average for this school's Math and English test scores: 52.7%1-c
This school is in the 71.26th percentile1-d
when compared to other schools of the same type: Elementary-High Combination
|
SAT Test Results:
| Average Reading Score | N/A |
| Average Math Score | N/A |
| Percent Tested | 0% (0 out of 152 seniors) |
Dropouts:
| Grade | Dropouts | Enrolment |
|---|
| 7 | 4 (4.21%) | 95 |
| 8 | 2 (2.67%) | 75 |
| 9 | 3 (6.52%) | 46 |
| 10 | 2 (3.51%) | 57 |
| 11 | 12 (15.79%) | 76 |
| 12 | 27 (17.76%) | 152 |
Student Ethnicity:
| White |
45.27% |
| Hispanic or Latino |
31.24% |
| Two or More Races |
9.67% |
| Asian |
6.65% |
| African American |
3.12% |
| Not reported |
2.7% |
| Filipino |
1.25% |
| Pacific Islander |
0.05% |
| American Indian or Alaska Native |
0.05% |
|
|
Notes:
- California School Ratings (CSR) computes percentiles in this way:
- For a given grade level, all Math scores are put into an ordered list and a percentile is calculated for each score, based its position in the list.
- For a given grade level, all English scores are put into an ordered list and a percentile is calculated for each score, based its position in the list.
- Math and English percentiles from (a & b above) are weighted, based on the number of students who completed each type of test, to create a combined Math+English weighted percentile for each school.
- The combined Math+English weighted percentiles are put into an ordered list for the particular type of school
(elementary/middle/high school/K-12) and a percentile-within-the-school-type is calculated.
- How percentiles work: the school percentile is a number between 0 and 100 that reflects the percentage of
schools of the same type (elementary/middle/high school/K-12) in California that have an equal or lower combined Math+English weighted percentile (from 1-c above).
For example, a school in the 70th percentile would have a combined weighted percentile that was equal to or better than 70% of the other schools of the same type.
- The CSR Rank is determined by a school's percentile in
comparison to other schools of the same type in California (from 1-d above).
(1 is the worst, 10 is the best). Schools in the 90th percentile and above have rank 10, 80%-89.999% rank 9 and so on.
A similar number of schools occupy each rank.
* This rank is derived from data in the 2016 California Assessment of Student Performance and Progress (CAASPP).
- Alternative Schools receive percentiles, but are not ranked
- More information: 2016 CAASPP Paper-based Test Results

 Compare with other schools in Acton